Monitoring SQL Server instances and databases provides information necessary to diagnose and troubleshoot SQL Server performance issues, as well as to fine tune SQL Server. Optimal performance is not easy to define and set, as there is usually a trade-off between multiple software and hardware factors. It also depends on your environment, business requirements, and company policy.
While slow reporting may be acceptable in a small factory, it’s not in large enterprises where slowdowns, hiccups, and bottlenecks affect a large number of users and can significantly affect business. The listed issues are usually unacceptable and must be fixed as soon as possible.
Once SQL Server performance is tuned, it has to be constantly monitored, as everyday data, schema, and configuration changes often lead to a situation where additional, manual tuning is needed. The most common example is obsolete statistics – a query runs well and then, without any obvious reasons, becomes very slow.
To have a fine tuned, optimally performing SQL Server instance, a DBA must be proactive and to monitor system performance constantly, define normal trends and set baselines for specific SQL Server performance metrics, be notified about metrics that are out of the normal value range, and take adequate actions.
What SQL Server metrics to monitor?
The metrics that should be monitored depend on your performance goals. However, there is a range of commonly monitored metrics that provide the information sufficient for basic troubleshooting. Based on their values, additional, more specific metrics could be monitored in order to find the root cause of the problem.
These commonly monitored SQL Server performance metrics are memory and processor usage, network traffic, and disk activity.
Besides monitoring SQL Server parameters, it’s recommended to monitor parameters for the specific database, as well as Windows system parameters.
The commonly monitored metrics are: processor time, processor queue length, page reads and writes per second, page life expectancy, target and total server memory, buffer cache hit ratio, batch requests, processor utilization, lazy writes, network usage, paging, user connections, etc.
SQL Server provides two built-in monitoring features: Activity Monitor and Data Collector.
Activity Monitor
Activity Monitor tracks only the most important SQL Server performance metrics. To obtain them, it executes queries against its host SQL Server instance every 10 seconds. The performance is monitored only while Activity Monitor is opened, which makes it a lightweight solution with almost no overhead.
The metrics are shown in 5 collapsible panes: Overview, Processes, Resource Waits, Data File I/O, and Recent Expensive Queries.
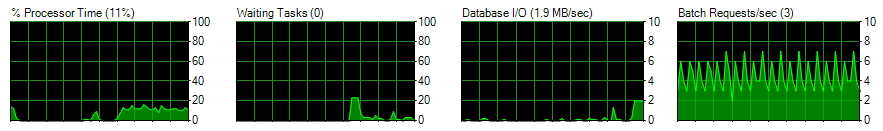
The Overview pane shows the processor time percentage, number of waiting tasks, database I/O operations in MB/sec, and the number of batch requests.
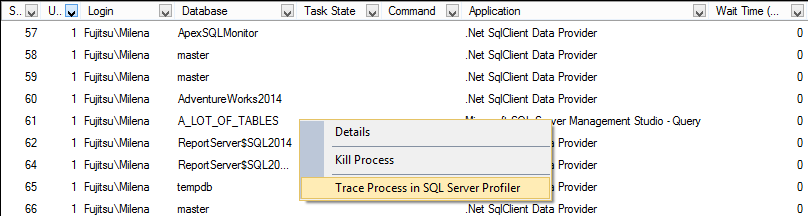
The Processes pane shows currently running SQL Server processes for each database on the instance. The information shown is: login, application, and host used, tasks state and command, wait time, etc. The information in the table can be filtered by the specific column value.
The Process pane context menu provides a feature useful for deeper analysis and troubleshooting. That’s tracing the selected process in SQL Server Profiler.
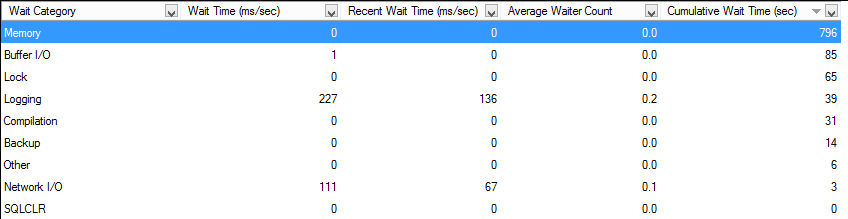
The Resource Waits pane shows waits for different resources: memory, compilation, network, etc.
It shows the wait time (the time SQL Server tasks are waiting on system resources), recent wait time, cumulative wait time, and average waiter counter.
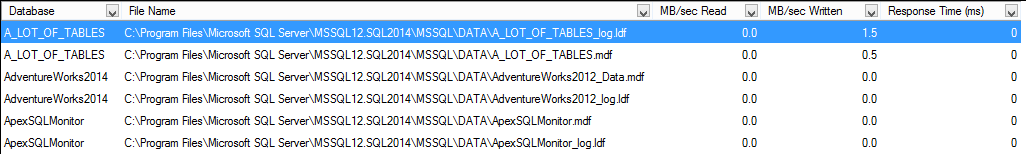
The Data File I/O pane shows a list of all database files: MDF, NDF, and LDF, their names and paths, recent read and write activity, and response time.
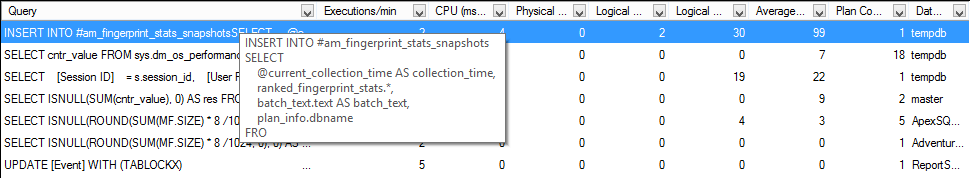
The Recent Expensive Queries pane shows the queries executed in the last 30 seconds that used most of hardware resources: processor, memory, disk, and network. The context menu enables opening the query in a SQL Server Management Studio query tab and opening its execution plan.
How to use Activity Monitor
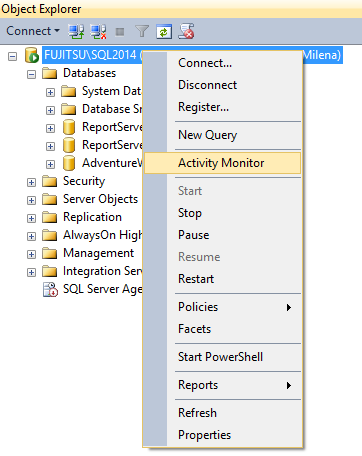
Activity Monitor can be opened via the SQL Server Management Studio toolbar’s Activity Monitor icon, keyboard Ctrl+Alt+A shortcut, or the SQL Server instance context menu in Object Explorer.
As shown, Activity Monitor tracks only a pre-defined set of the most important SQL Server performance metrics. Additional metrics cannot be monitored; the monitored ones cannot be removed. Only real time monitoring is possible. There’s not built-in option to save metrics history for later use. Therefore, Activity Monitor is useful for current monitoring and basic troubleshooting; for any deeper analysis and performance tuning, a monitoring tool where monitored metrics can be selected, threshold values defined, and historic data stored is necessary.
Data Collector
Data Collector is another SQL Server Management Studio built-in performance monitoring and tuning feature. It collects performance metrics from SQL Server instances, saves it in a local repository, so they can be used for later analysis. It uses Data Warehousing, SQL Server Agent, and Integration Services.
Unlike Activity Monitor, Data Collector allows you to specify the metrics you will monitor. It offers three built-in monitor metrics sets (data collectors) with the most important and commonly monitored performance metrics. To monitor additional performance metrics, custom data collectors can be created via T-SQL code or API.
How to use Data Collector
Make sure that SQL Server Integration Services are installed and SQL Server Agent, Management Data Warehouse, and Data Collection are enabled.
- Expand Management in SQL Server Management Studio Object Explorer
- In Data Collection context menu select Configure Management Data Warehouse
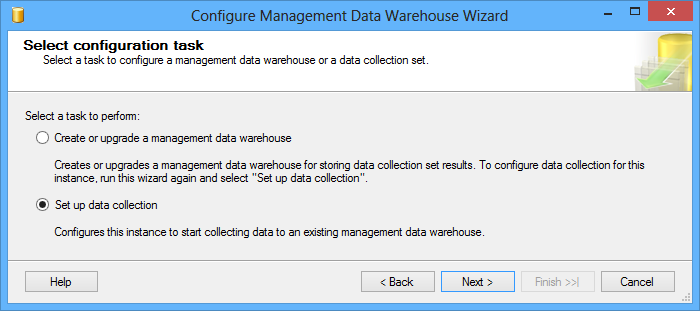
Select Set up data collection
Click Next
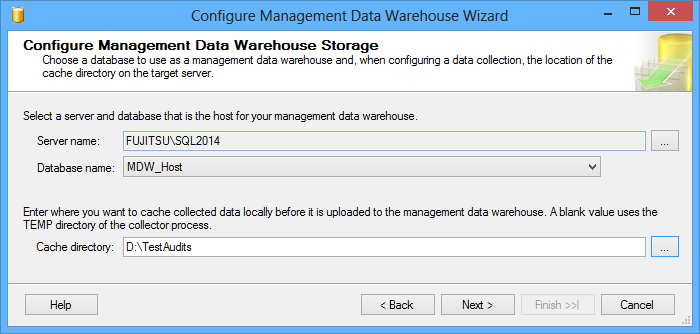
Select the SQL Server instance name and the database that will host the management data warehouse, and the local folder where the collected data will be cached
Click Next, review the settings, and click Finish
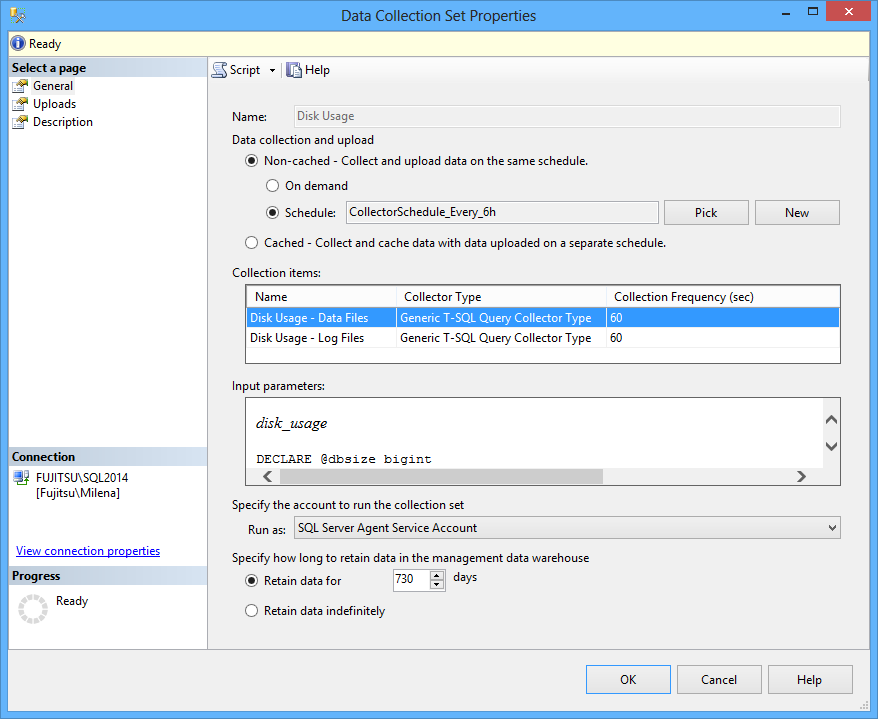
Data Collection provides three pre-defined sets, available in the System Data Collection Sets folder in the Object Explorer Management | Data Collection node: Disk Usage, Query Statistics, and Server Activity. Each has its built-in report.
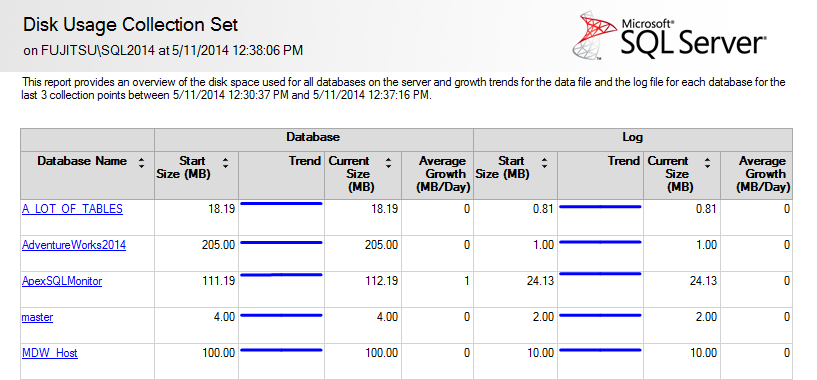
The Disk Usage data collection set collects data for the database data files (MDF and NDF), transaction log file (LDF), and I/O statistics.
The Disk Usage built-in report is available in the Data Collection context menu. It shows disk space used by the database files, growth trends, and average day growth.
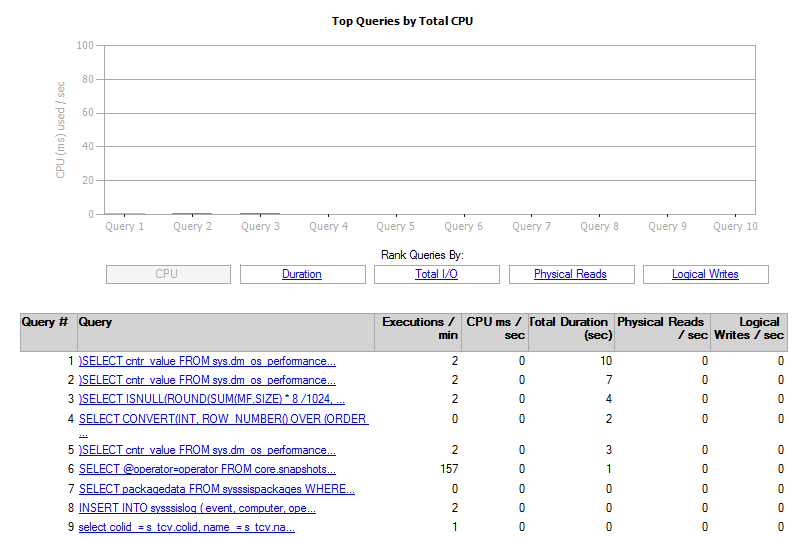
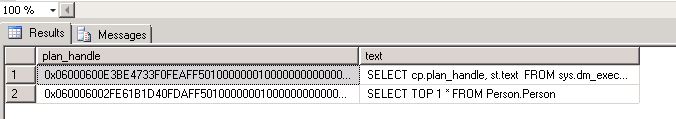
The Query Statistics data collection set collects query code, statistics, activity, and query execution plans for the 10 most expensive queries.
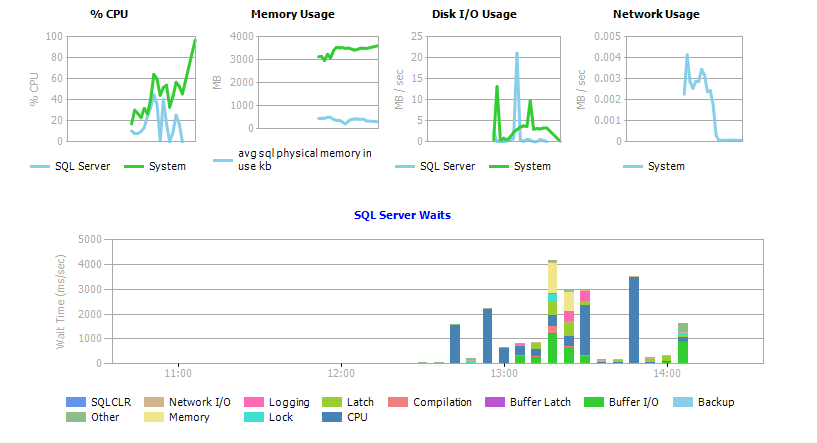
The Server Activity data collection set collects data about processor, memory, disk I/O, and network used. The report shows CPU, memory, disk I/O, and network usage, SQL Server waits, SQL Server instance, and operating system activity.
As shown above, Data Collection has to be configured and started in order to capture data. It provides three built-in collection sets and adequate reports. There is no wizard for adding additional metrics; it has to be done through code.
One of the Data Collector advantages is that it doesn’t have to collect data all the time, but only in pre-defined schedules, and thus adds less overhead. A downside of the feature is that there’s no option to select the databases on the SQL Server instance that will be monitored, all databases will be monitored, which adds overhead, noise to the collected data, and requires more disk space.
The feature is not available in SQL Server versions earlier than 2008 and in editions other than Enterprise, Standard, Business Intelligence, and Web.
Unlike Activity Monitor, there is no option to watch real-time graphs, but captured data can be saved for a specified number of days. The feature provides basic performance metrics, but coding knowledge is required for monitoring any additional metrics.
ApexSQL Monitor
ApexSQL Monitor is a
SQL server monitoring software that monitors system, SQL Server, and database performance in real time through more than 30 counters. It allows users to select the SQL Server instances and databases that will be monitored, to select the metrics for each database, SQL Server instance, and machine, and to specify the metrics and threshold values that if exceeded, the alerts will be raised. ApexSQL Monitor shows the performance metrics in real-time graphs, and stores the corresponding metrics data in a central repository database for later use.
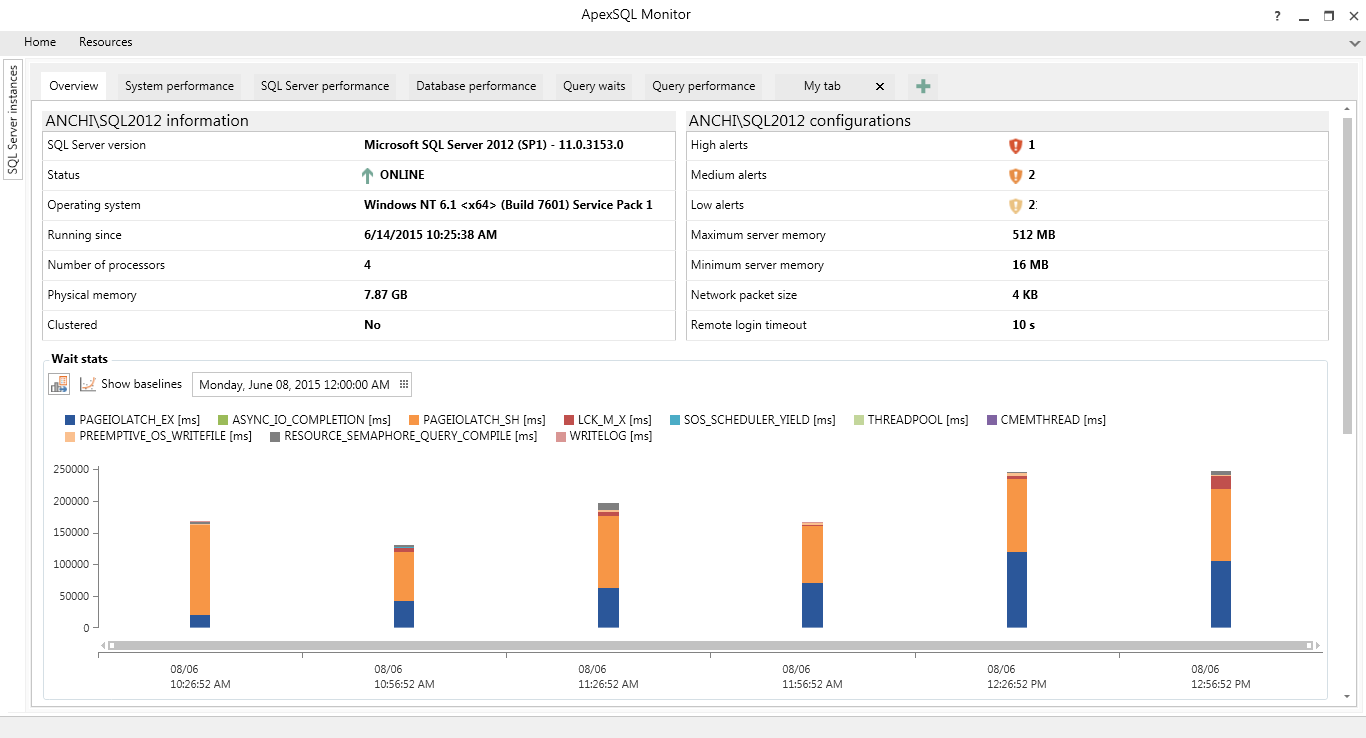
The captured performance metrics and queries data are shown as a graphs in six default tabs, but also in user created custom tabs.
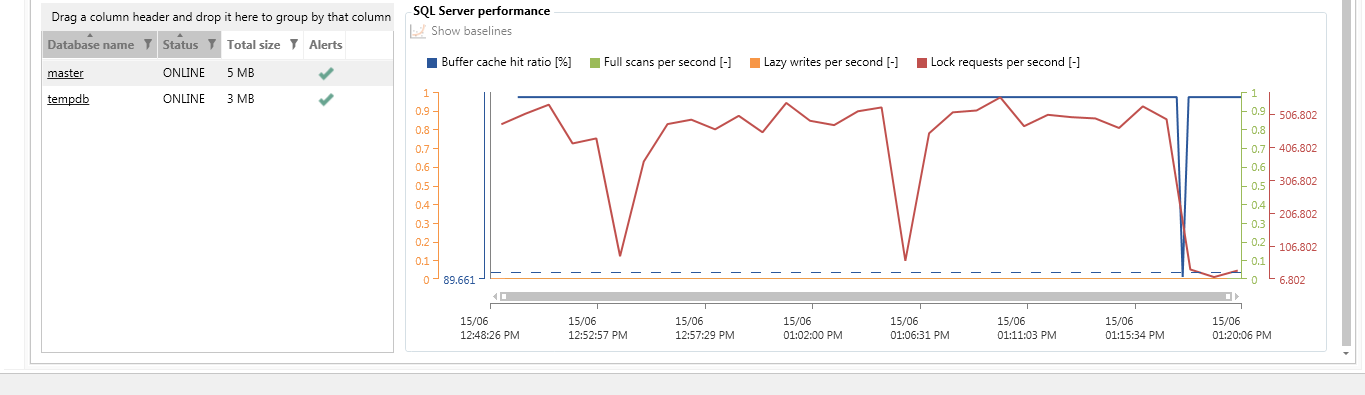
The Overview tab shows the most important SQL Server information and configuration and SQL Server wait stats and performance metrics (buffer cache hit ratio, full scans per second, lazy writes per second, and lock requests per second).
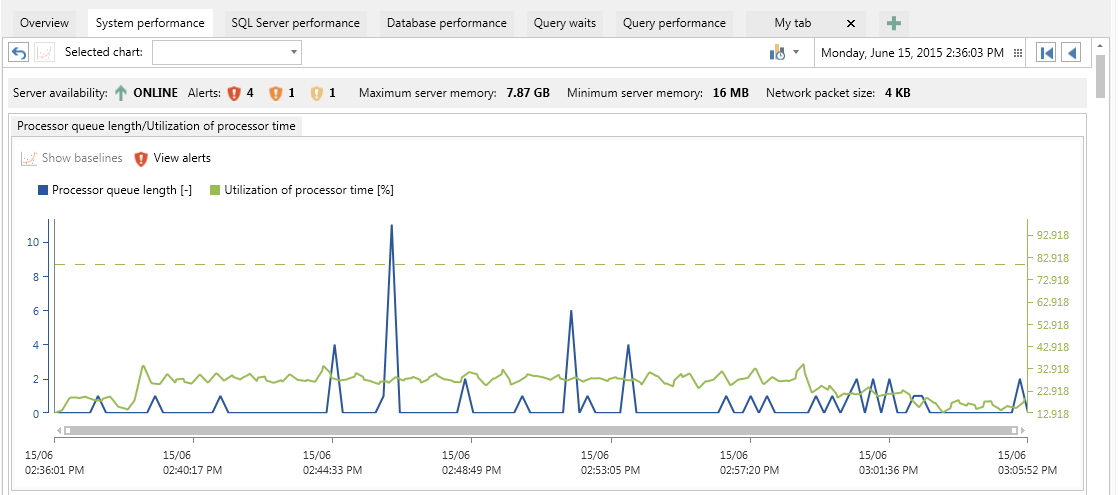
The System performance tab shows the operating system performance metrics: processor queue length/utilization of processor time, network utilization, paging file usage, page input per second, pages per second, average bytes per write/read, average and current disk queue length, average read/write time, disk writes/reads per second, free space and available memory in MB.
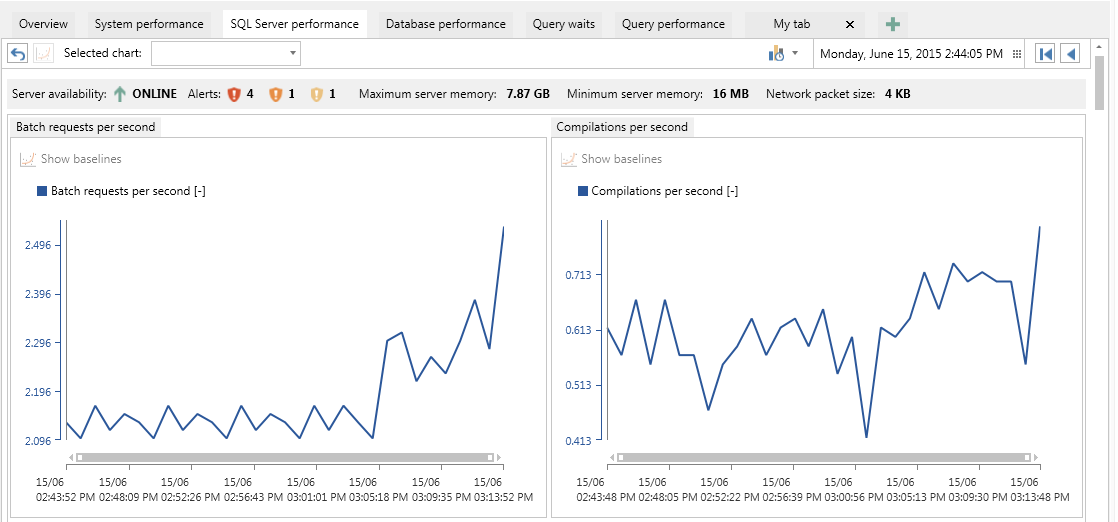
The SQL Server performance tab shows metrics related to SQL Server instance performance: the number of batch requests, compilations and re-compilations per second, longest running transaction, full scans, index searches, forwarded records, free list stalls, lazy writes, lock requests, and deadlocks per second, user connections, target and total server memory in KBs, memory grants pending, buffer cache hit ratio, page life expectancy, page reads/writes, and page splits per second.
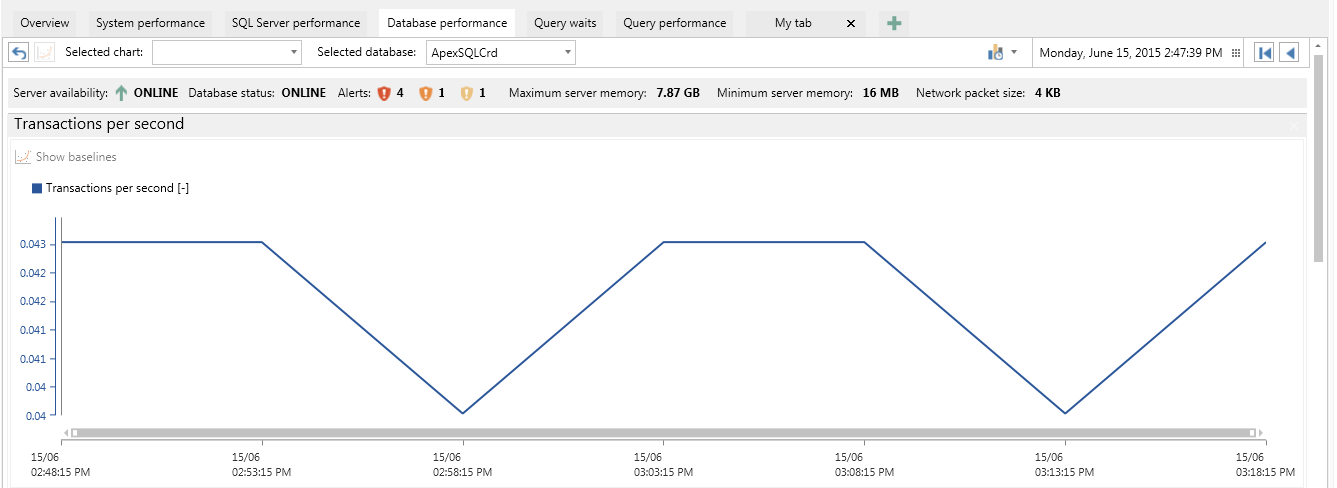
The Database performance tab shows details about database data and transaction log file size, and number of transactions per second.
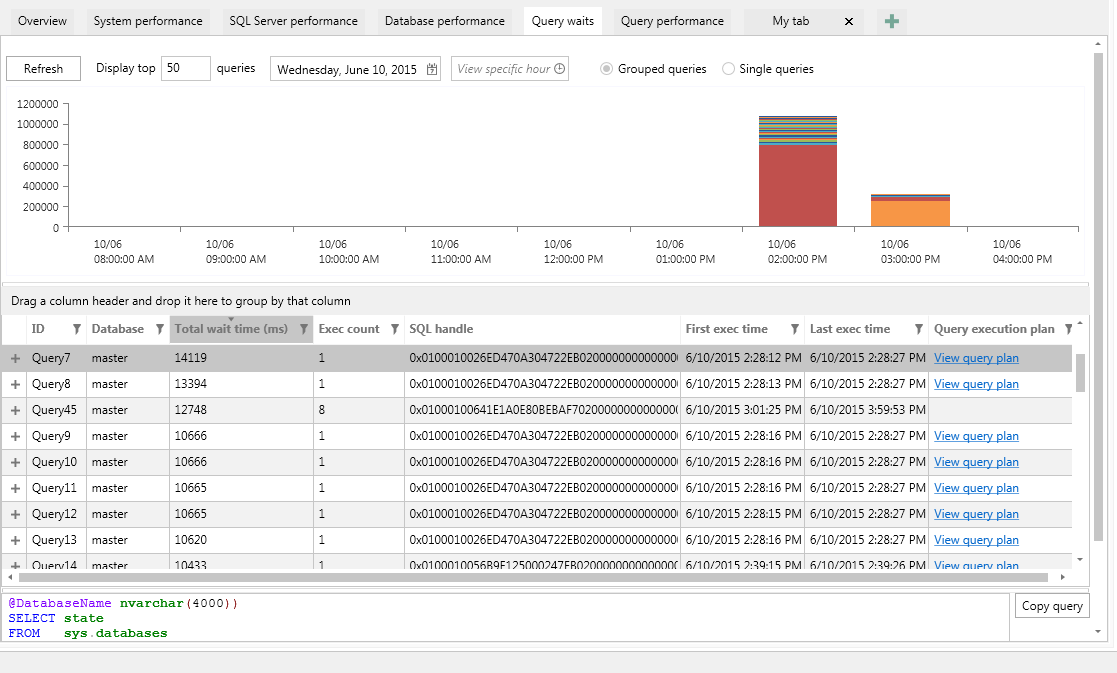
The Query waits tab shows the top queries with the largest wait time during the selected time period, including the graphical presentation of the queries and their wait times. Also, single or grouped query details and query plans can be reviewed and analyzed.
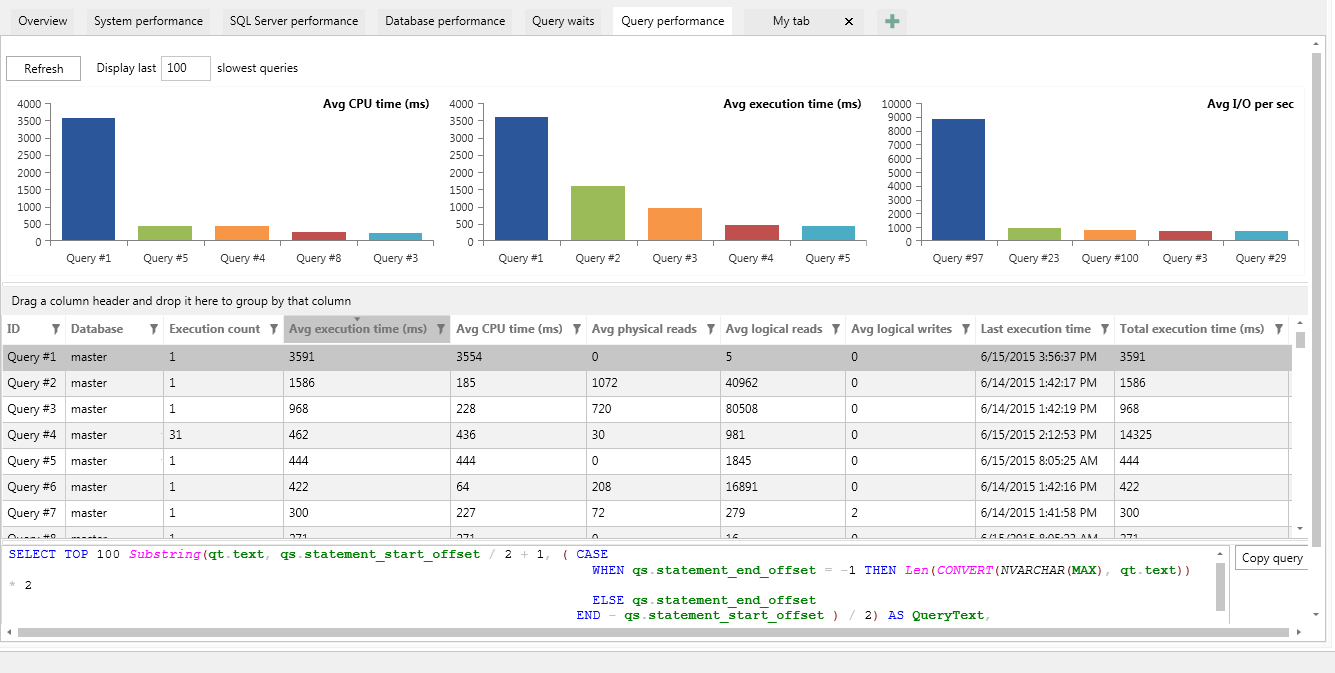
The Query performance tab shows the top queries that used the most resource during the selected time period, including the graphical presentation of the slowest queries by average CPU time, average execution time, and I/O per second. The number of queries can be selected by the user.
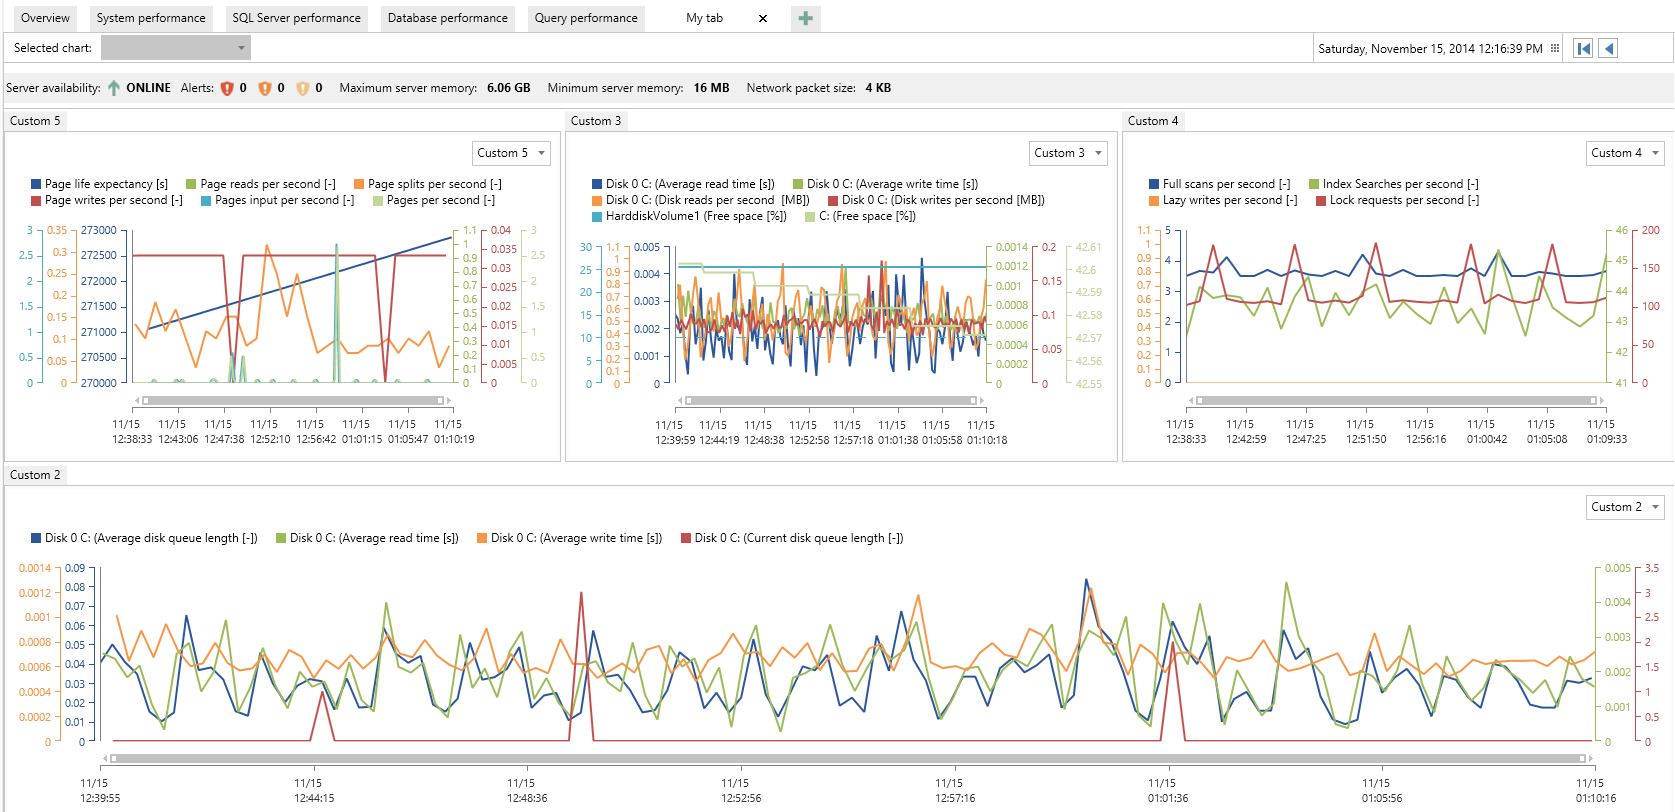
Custom tabs can be molded for individual users need. Users can make and set their own tabs to be displayed so as to know on critical metrics quick and easy after they start the ApexSQL Monitor. The custom tabs can be created to provides an at-a-glance overview of the most important system, SQL Server instance, and database metrics arranged in a way that can give the easy insight of the potential problem
How to use ApexSQL Monitor
- Start ApexSQL Monitor
- Click Add in the menu to add the SQL Server instance you want to monitor. All monitored SQL Server instances will be shown in the SQL Server instances list on the left
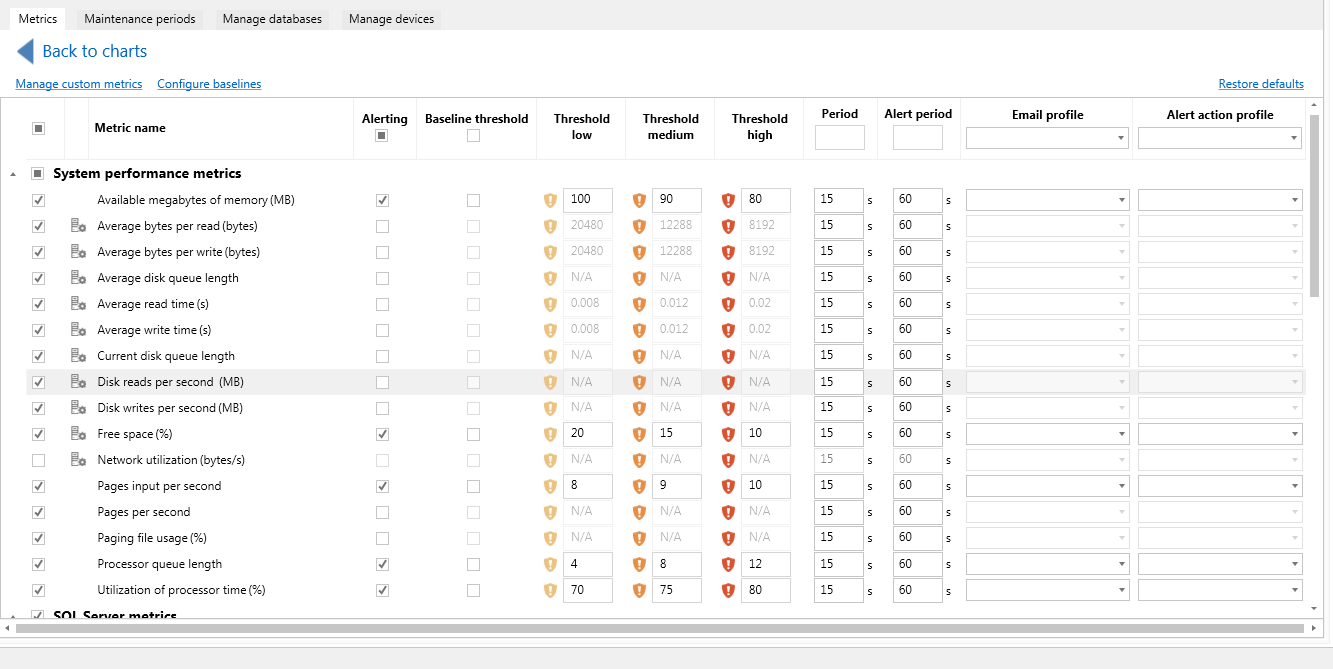
To configure the monitored performance metrics, click Metrics in the menu. The metrics monitored can be configured on the device, database, SQL Server instance, and machine level
In the same screen, you can configure alerts. To enable an alarm, select the Alerting check box and enter the threshold values, or use baseline threshold if baseline values are calculated
- After you’ve set the alerts and metrics, click Apply at the top of the form
If there’s an alert, it will be indicated by an icon next to the SQL Server instance in the Servers list. To see the list and details for active alerts, click Alerts in the menu. It shows the performance metric, start and end time, and number of occurrence for each severity level.
ApexSQL Monitor is a monitoring solution easy to start and configure, and no coding knowledge is required. It provides granular monitoring, and unlike native SQL Server monitoring solutions, it enables selecting the metrics, as well as databases that will be monitored. Different metrics can be monitored for each device, database, SQL Server instance, and operating system. This reduces overhead added by the monitoring process.
Unlike Activity Monitor and Data Collector, ApexSQL Monitor shows the metrics in real-time graphs, stores historic data in a central repository, and displays the historic data in graphs. Alerts can be configured in a few clicks, with a specific threshold value entered for low, medium, and high severity alerts.